Request a Demo
Cost Management & Profitability Analysis via ERP: Uncover 43% of Loss-Making Products & Boost Profits 27%

Cost Management & Profitability Analysis via ERP: Uncover 43% of Loss-Making Products & Boost Profits 27%

Cost Management & Profitability Analysis via ERP

Cost & Profitability Analysis

ABC Costing & Uncovering Loss-Making Products via ERP

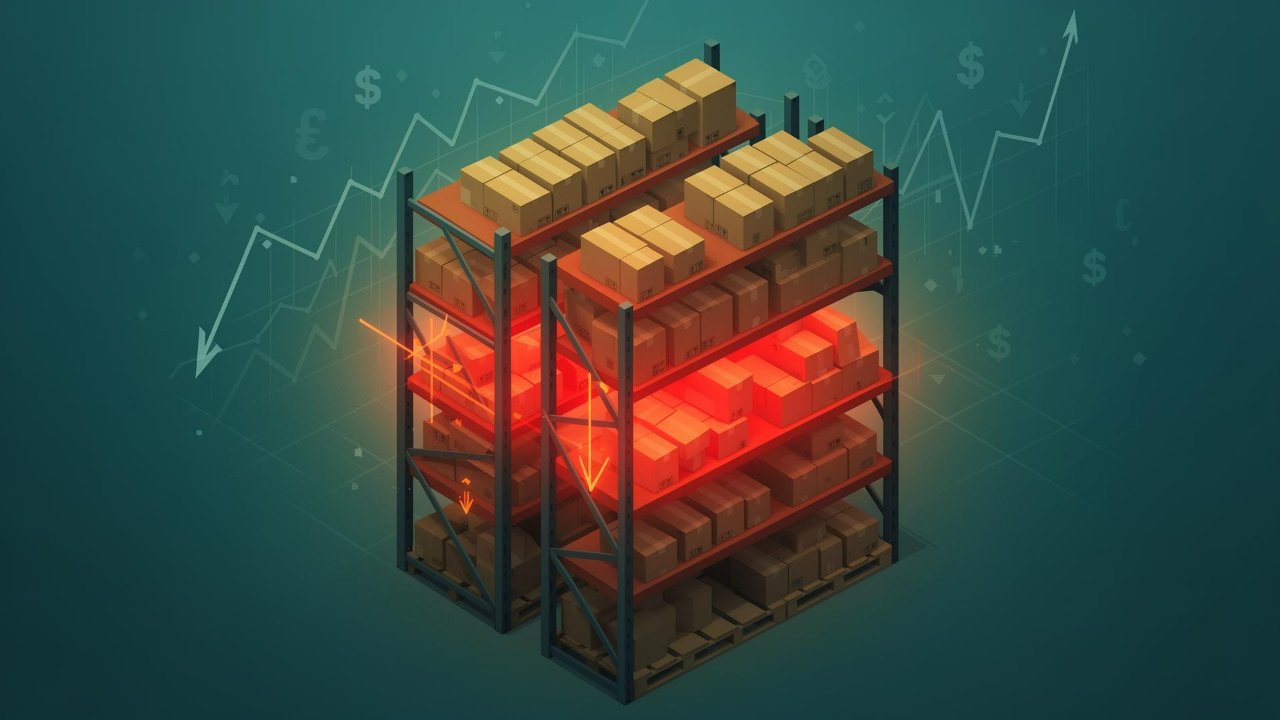
In an economy of shrinking margins and rising costs, the question is no longer “Are we profitable?” but “Where do we profit and where do we lose?”. A Bain & Company (2026) study reveals that 43% of Gulf companies’ products generate negative margins without management’s knowledge, and implementing detailed profitability analysis via ERP increases net profits by an average of 18-27% in the first year.

43%

Products with Hidden Losses

71%

Companies Suffer Cost Blindness

27%

Potential Profit Increase

3 Mo

Average ROI Payback

Why Companies Fail to Understand True Costs

KPMG Middle East (2026) reports that 71% of Saudi companies suffer from “cost blindness”:

  • Hidden costs: 23% of operating costs are “invisible” in traditional systems — utilities, depreciation, opportunity costs, quality rework
  • Misleading allocation: Equal distribution of overhead hides which products, branches, and customers are truly profitable
  • Time lag: Knowing profitability 30-45 days after period end means missing the correction window entirely
  • No Activity-Based Costing: Without linking activities to costs, pricing becomes guesswork — and “busy” doesn’t mean “profitable”
  • Revenue vs. profit confusion: Your biggest customer by revenue may be your biggest loss-maker when cost-to-serve is factored in

6 Dimensions of Profitability Analysis

1. Profitability by Product / Service

The system calculates the full cost of each product — raw materials + direct labor + activity-based overhead — and compares it to the actual selling price after discounts:

  • ABC costing: Allocate overhead based on actual resource consumption — not volume-based averages
  • Contribution analysis: Separate variable and fixed costs to identify contribution margin per unit
  • Price waterfall: Track the journey from list price to net realized price — discounts, rebates, delivery costs, returns
  • Discovery: Typically 15-20% of products generate 80% of profits, while 30% generate net losses

2. Profitability by Customer

Not every large customer is profitable. The system measures cost-to-serve:

  • Service intensity: Order frequency, delivery requirements, return rates, and after-sales service calls
  • Payment behavior: Late payment costs (capital cost of overdue receivables)
  • 4-tier classification: Stars (high revenue/high profit), Growth Opportunities, Neutral, and Loss-making
  • Action plan: Reprice loss-makers, reduce service intensity for low-value customers, invest in Stars

3. Profitability by Branch / Region

Compare each branch’s performance accounting for local costs:

  • Localized costs: Rent (varies 3x between Riyadh and regional cities), regional salaries, and logistics
  • Revenue per sqm: Compare branch productivity on a space-normalized basis
  • Break-even analysis: How much must each branch sell monthly to cover its costs?
  • Expansion/closure decisions: Based on real data, not impressions — data-driven portfolio management

4. Profitability by Project

  • Real-time cost tracking: Labor, materials, subcontractors, and overhead — tracked per project as they occur
  • Budget burn alerts: System warns when any line item exceeds 85% of allocation — giving managers time to correct
  • Earned value analysis: Compare planned vs. actual progress to predict final project profitability
  • Post-project review: Actual vs. estimated profitability — feeding back into future project pricing

5. Dynamic Break-Even Analysis

  • Real-time calculation: Break-even point auto-updated as costs change — not a static annual number
  • Multi-product: Weighted break-even considering product mix and contribution margins
  • Scenario modeling: “What if raw material costs rise 10%?” — instant recalculation of break-even volumes
  • Visual alerts: Dashboard shows days remaining to break-even this month — creating urgency when behind target

6. What-If Scenario Analysis

  • Cost simulations: “What happens to net profit if raw materials rise 15%?”
  • Pricing simulations: “If we raise prices 8%, what’s the impact at various elasticity levels?”
  • Product mix: “What if we discontinue the bottom 5 products and reallocate resources?”
  • 3 scenarios: Optimistic, realistic, and pessimistic — each with P&L and cash flow impact

Case Study: Food Distribution — 85 Products, 12 Branches

Food Distribution — SAR 180M Revenue — 85 Products — 12 Branches — “Apparent” 8% Margin

What ERP profitability analysis revealed: 18 of 85 products (21%) generate net losses after ABC allocation. 3 of 12 branches operating below break-even for 8 months. Top 5 customers consume 41% of service resources despite being 27% of revenue.

8%→14%

Net Profit Margin

SAR 4.8M

Additional Profits

11

Products Repriced/Cut

3 Months

ROI Payback

• 11 loss-making products discontinued or repriced — freeing warehouse space and capital

• 2 underperforming branches restructured — one converted to distribution-only (no showroom)

• Delivery cost allocation revealed free-delivery was costing 4.2% of revenue — minimum order values introduced

Implementation Roadmap — 12 Weeks

Phase Timeline Deliverables
1. Cost Structure Audit Week 1-2 Map all cost pools, identify direct vs. indirect costs, define activity drivers for ABC
2. ABC Configuration Week 3-5 Configure activity centers, define cost drivers, set allocation rules per product line
3. Multi-Dimensional Analysis Week 6-8 Customer profitability setup, branch-level P&L, project cost tracking activation
4. Dashboards & Training Week 9-10 Executive profit dashboards, break-even monitors, scenario modeling tools
5. Go-Live & Optimization Week 11-12 Team training, first profit review cycle, pricing adjustment recommendations

ROI Calculation

Savings Category Annual Value
Loss-making product elimination/repricing SAR 2,400,000
Customer cost-to-serve optimization SAR 890,000
Branch performance improvement SAR 620,000
Overhead allocation accuracy SAR 450,000
Pricing precision improvement SAR 340,000
Total SAR 4,700,000/year

💡 Pro Tips for Maximum Impact

  • Start with ABC costing on your top 20 products — these typically represent 80% of revenue. Expand gradually to the full catalog.
  • Run customer profitability analysis quarterly — customer behavior changes with seasons, promotions, and market conditions.
  • Don’t just cut loss-makers — some loss-making products are “door openers” that drive profitable cross-sells. Analyze the bundle, not just the item.
  • Share profitability data with sales teams — when salespeople see cost-to-serve data, they naturally prioritize high-profit customers and products.
  • Link profitability to incentives — reward sales teams on gross profit contribution, not just revenue. This single change can improve margins by 8-12%.
  • Review break-even monthly — in volatile commodity markets (Saudi food distribution, building materials), break-even shifts rapidly with input costs.

Frequently Asked Questions

How long does it take to see profitability improvements?

Most companies identify their first batch of loss-making products within 2-3 weeks of ABC costing activation. Margin improvements of 3-5% are typically visible within the first quarter. The full 18-27% improvement takes 6-12 months as pricing, product mix, and customer strategies are refined based on data.

Is ABC costing practical for companies with 500+ products?

Yes — modern ERP systems handle ABC allocation automatically once activity drivers are configured. The key is defining 8-12 meaningful activity centers (e.g., procurement, warehousing, quality inspection, delivery, after-sales) rather than trying to track every micro-cost. The system does the math across all products.

How does this work with ZATCA e-invoicing requirements?

Profitability analysis operates on the same transaction data that feeds ZATCA compliance. Every invoice, credit note, and payment captured for e-invoicing flows into the profitability engine — ensuring cost and revenue data is always synchronized with tax-compliant records.

Can we analyze profitability across multiple entities or subsidiaries?

Multi-entity profitability analysis is a core ERP capability. The system consolidates data across subsidiaries, eliminates intercompany transactions, and provides both entity-level and group-level profitability views — essential for Saudi holding companies managing diverse business portfolios.

What about seasonal businesses — does ABC costing work year-round?

For seasonal businesses (common in Saudi food distribution, retail, and construction), ERP provides seasonal cost allocation that adjusts overhead distribution based on activity levels. During low seasons, fixed costs are spread differently to avoid distorting product profitability — preventing misguided decisions to cut products that are actually profitable during peak periods.

Conclusion

Profitability analysis isn’t about cutting costs — it’s about understanding where value is created and destroyed. Companies that implement ERP-powered ABC costing and multi-dimensional profitability analysis don’t just improve margins by 18-27% — they transform decision-making from gut feel to data-driven precision. With 43% of Gulf products generating hidden losses, the question isn’t whether you can afford to implement profitability analysis — it’s whether you can afford not to.

References

Subscribe our Blog through email?